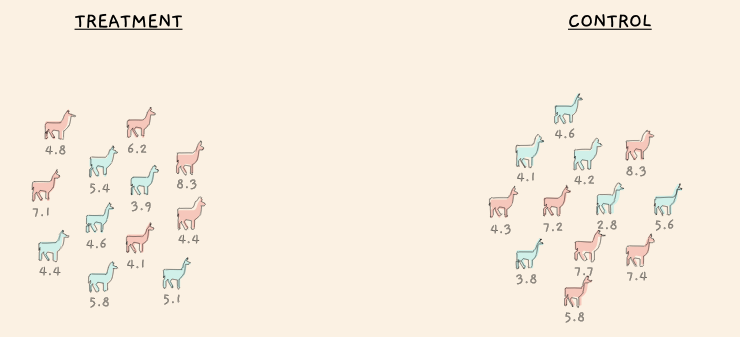
Sheep wool experiment, taken from Jared Wilber
Jared Wilber has an amazing interactive visualization illustrating the permutation test. I highly recommend reading it to get a better visual intuition of how the test statistic of the permutation test is derived.
However I feel not enough emphasis was given on the logic of why the permutation test works to begin with. One student in the stats class I’ve TA’ed brought up this self-same question. Why does it make sense. I’m reproducing the answer I gave to him and the rest of the class.
Why does the permutation test make sense?

Photo by Jacqueline Munguía on Unsplash
Suppose you were designing an experiment to test the efficacy of a new (prescription) drug that’s supposed to make you happier. Some participants will be placed in the treatment group and others in the control group. If the null hypothesis (the drug has no positive effect on happiness) is true, it wouldn’t matter where each person were assigned as each would have gotten the same outcome anyway. On the other hand, if the alternative hypothesis is true, it really would matter where you were assigned – if the drug does in fact work, being in the treatment group could truly affect your before-and-after happiness level.
But under the null there is no advantage of being in the treatment or control group. This means there’s nothing special about the particular arrangement and outcome of people that we observe. It’s just one of nC2 possible arrangements that could have arisen by chance (“n choose 2” in combinatorics, where n is the total number of participants and 2 since there’s 2 groups). For example, if there’s a total of 100 participants, then there’s 4950 possible assignments into treatment and control groups.
under the null there is no advantage of being in the treatment or control group. This means there’s nothing special about the particular arrangement and outcome of people that we observe. It’s just one of nC2 possible arrangements that could have arisen by chance
Suppose that the average happiness in the control is 40 while it’s 85 in the treatment group. This means a happiness differential of 45. Let’s also suppose that out of the 4950 chance arrangments, we observe this difference or an even larger difference (see my article for more on this) only 15 times. This implies if chance alone were responsible for the higher observed difference, there’d be only a \(15/4950 = 0.3\%\) probability of seeing this or an even larger difference happen. We either were lucky to observe a very rare circumstance, or maybe the null is in fact false.

Photo by Josh Appel on Unsplash
To build off that idea, imagine flipping a coin 500 times and getting heads every time. You could either say “I was really lucky!” or “Hmmm something seems fishy.” It’s the same idea in the permutation test. Most would probably agree the coin scenario is fishy. Why? Because we’re working under the assumption that the coin is fair! Thinking in terms of hypothesis testing, if the null were true (if the coin were fair), it’d be highly unlikely to get 500 heads in a row. Because of its rarity, we’d conclude the coin is probably weighted.
Tying this back to the drug study, if the null were true (that is, if the drug has no positive effect on happiness), it’d be highly unlikely just by pure luck to observe such a large difference in happiness (45) after taking the drug. So we conclude the drug actually makes people happier.